
More information in less space.
It is amazing how sometimes similar applications can come back to back….Last week's blog came from a customer asking how to measure the main power grid frequency. And later the same week I had a totally different customer ask me about how he could display upper, lower and current value of the main electrical grid frequency in groov. What are the chances of that!!??
This customer wanted one gadget to display all three values. Why so dense? Because they only use groov on smart phones, no PCs or Tablets. He was polling the data from a bank of UPSes and so needed to display a lot of data. Screen real estate is prime on those devices. What can we do to help?
In this week's blog, we are going to have some adventures in Z-Order.
Layers. It's all about layers.
groov is just like most other graphic editing and creating programs. You can have gadgets overlap or stack on top of each other and the order that this happens is called Z-Order. Being an airplane lover, I think of it as altitude. The object with the highest altitude appears on the top of all others. You can also think of it as one object being in front of others. Depending on the gadget's graphic elements, it might totally obscure any objects behind it, or it might only partly obscure them. And here is the key and the exciting bit: you can use this behavior to achieve different functionality.
You have two ways to order any gadgets in groov. As you drag and drop them onto the canvas, the last one placed is always in front of the others. Or if you right-click the highlighted object, you can select “Bring To Front” or “Send To Back” from the popup menu.
I did not have a UPS to poll the data from, so I used the SNAP-AIRATE-HFi module from last week's blog. The live power grid frequency is an analog input, and the max and min frequencies are variables. Since the Opto 22 rack constantly checks for the max/min values of all its analog inputs, the code to get these values just needs to be run every second or so. It looks like this:
// Get the max and min mains frequency.
mains_frequ_max = GetAnalogMaxValue(mains_frequency);
mains_frequ_min = GetAnalogMinValue(mains_frequency);
In my test case this code is run every second, since that is the same as the poll rate for groov to get the data from the controller. (Remember, the analog input module is read much faster than this, so you will still catch any short variations in your analog input. We just read the max/min once a second to display in groov).
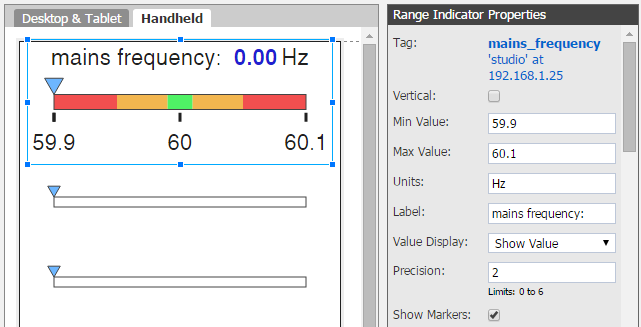
OK, so we have our three data points in the controller and we have groov. Technically, since you have full control of the Z-Order of every gadget, you can place them in any order you want and shuffle them to your heart's content… That said, I usually find it best to start with the live value and get that looking and working the way I want. Drag your chosen gadget onto the canvas (for me, it was the Range Indicator). Hook it to the correct tag and set your max and min values for the gadget. Keep track of these values as all three gauges are going to have to be the same.
While you are there, as a nice touch, add some zones to bring some color to the gadget. With the live value all set up and looking great, it’s time to start on the max and min value gadgets.
Here is a screen shot of how I set up my live value for this test.
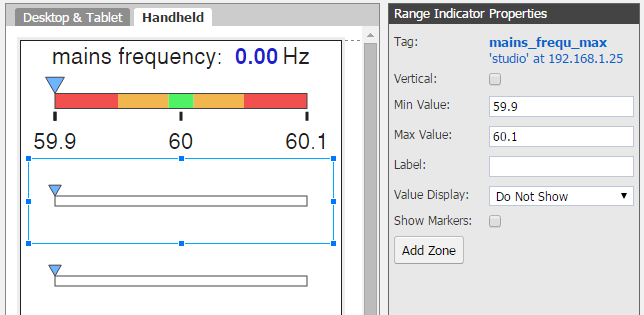
Click and drag another Range Indicator gadget over to the canvas. Attach it to the Min variable and set the range to be the same as the live value. It’s important to take the tick out of the "Show Markers" option. Also select “None” in the “Value Display” option and delete any text in the “Label” area, since we want to make these two gadgets as sparse as possible. Do the same for the Max value gadget as well. (Speed tip: right-click and select “Duplicate” from the popup menu, then just change the tag it’s connected to). It should look something like this:
Lastly, we just click and drag all three gadgets over the top of each other. You will clearly see if the live value is not on top; once you put it on top you are done. Click File > Save All Changes and Switch to groov View.
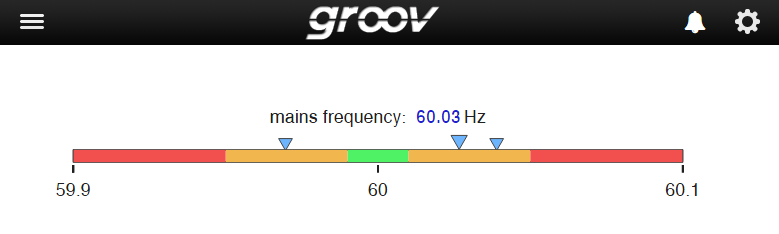
It’s a thing of beauty!
Note how we have made the max and min gadgets just a little smaller than the analog input; just another way you can convey information to the user.
Of course, if you wanted to, you could add text gadgets and show the max and min values, but that would take up more screen space..... But perhaps you are interested in seeing the deluxe version?
As an example of just that, here is a screen shot wrapping all that we have covered into a dial gadget.
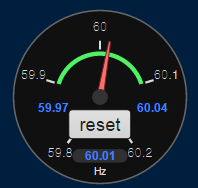
I built this round Gauge gadget with all the information on it to display the main power grid frequency data on my home groov demo.
The reset button was something that I quickly added into the mix. If you recall from last week's blog, I needed to know how much the grid frequency was changing, and I wanted to run tests over different durations with different frequency low-pass filters but still easily read the max and min grid frequency. The code is pretty simple;
if (mains_frequency_reset == 1) then
GetClearAnalogMaxValue(mains_frequency);
GetClearAnalogMinValue(mains_frequency);
endif
Add a momentary button gadget in groov and hook it to the reset variable. Now in groov view, press and hold the button till you see both values change to the current live value, and it's reset.
To build this configuration, you have the dial gadget at the back of the Z-Order and the two max/min text values and button are in front. Since those three gadgets do not overlap, we don't have to worry about their specific Z-Order. They just sit in front of the round gauge gadget.
Layer over layer. It's all in the layers.
So there you have it. You are not limited to stacking only 3 gadgets, but I suspect the more you add, the more your user will need to know what's going on and why. (Personally, I think a user interface (UI) should be self evident).
There is a great tech tip talking about stacked gadgets from my partner in skullduggery, be sure and check it out (and sign up for Opto News so you don't miss any more of them!).
What other groov gadgets can you stack up to increase the density of information conveyed?
Grab yourself a copy of the free groov demo software and have a play yourself. You don’t even need any hardware to talk to, since groov includes simulated tag data!
Till next week. Cheers, Mate.