
The biggest user of water in our house is not human:
A web browser is installed on most of the key devices we use every day. PCs, smart phones, tablets, even our TVs now have a modern web browser installed. I can even surf the web from my Android smart watch (a Moto360).
It makes sense then, does it not, to view everyday data on an interface that we use every day?
How much water flows through our house was the subject of last week's blog... It both surprised me and pleased me to find out that the biggest user of water in our house was not a human.
Visualizing water use with groov:
Here is the groov screen that shows our water use, right now, for the past week, for the current month, and for the year to date.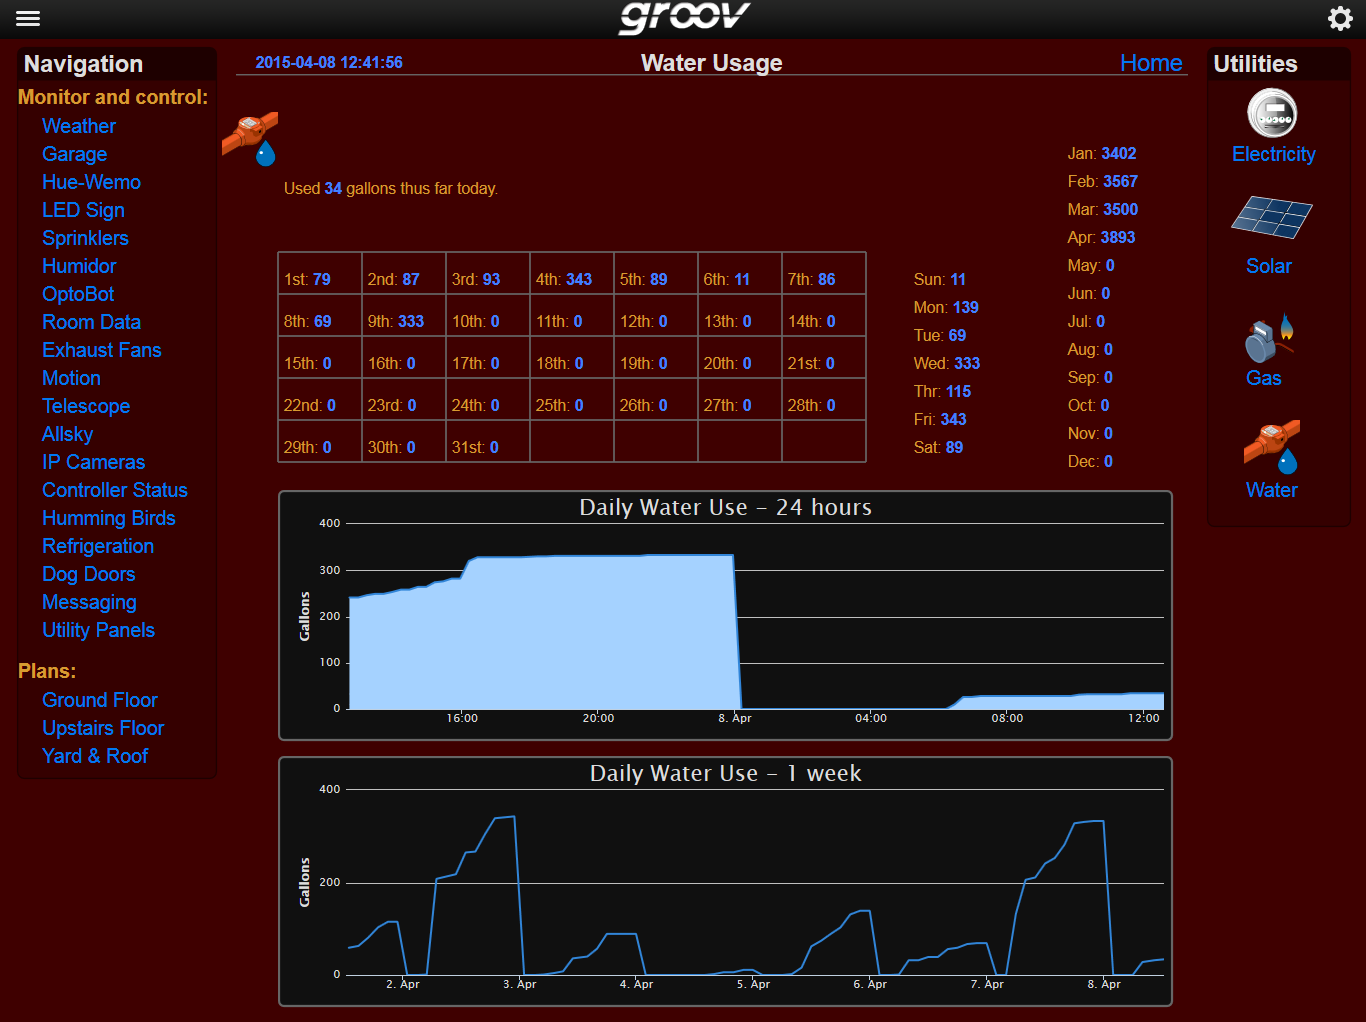
I think one of the most powerful aspects of this page is the trend. groov can trend a variable from 1 minute to 7 days.
It's the 7-day trend that really caught my eye.
Backing up a bit, just a few days after moving into our house, I was awake at 2 a.m. when I heard the sound of running water. Following my ears, I ended up in the garage looking (in the dark) at our whole-house water softener. Following my ears some more, I ended up in the laundry hearing what sounded like a little (but steady) stream of water going down the sink.
Words to the effect of "fair enough" floated through my head, and happy that nothing was actually getting wet, I wandered off to find something else to do (like raid the fridge of munchies).
We started the whole house monitoring thing just after we got our green cards back in 2010, and as we mentioned last week, saving water is front and center for every one in our family.
California has just this month imposed mandatory water restrictions. But there was no way we were going to wait this long to find out how much water we were using. Check out last week's blog for the details on the water meter we ended up installing.
Back to the water softener.

Sadly, that's where I left it for a long while. But it's back on my radar with the talk about the drought and the need to cut back on our water use.
I clearly remember looking and not finding any model number on the device, and so finding a manual back then was a bit tricky. This time however, I took a different tack. I took a photo of the control unit and using Google reverse image search, I found the manual in just a few clicks.
We are going to take a deep dive into the settings and see if we can't tune the thing up a bit and find a better balance between dumping water every few days and keeping the water quality where it should be.
Data is worth different things to different people. The same data point might be of no value to some people or industries, but to others, they would have paid double to see what is going on in their process.
I think we are somewhere in the middle. Why?
Within a week I found out two fairly major bits of information.
Firstly, we found the true cost of having the whole house water softener: ~200 gallons of water down the drain twice a week.
But critically, we found out via the trend in groov that our new water meter was not providing all the information that we expected.
When we decided to install the water meter, I scouted around the house and yard and confirmed to myself that the water softener in the garage was indeed the water main's point of entry into the house. A tiny voice in the back of my head mumbled something about how it was a bit weird that the garden and lawn irrigation water also went through the softener, but the voices in my head have been saying a lot of things since we moved over from Australia; not all of them should be listened to... but this one time, I was wrong.
It was clear, both from the data and from listening, when the Opto controller started cycling through the zones in the garden, the water meter did not show any flow, and I could not hear any flow anywhere near the house!
Just a side note, I have just mentioned listening to the pipes now, and we also mentioned the same thing in last week's blog... It's a habit or technique that my old boss Ray taught me at the hospital we worked at. When setting up, tuning, or fault finding a process, take a moment to listen, and if it's safe, touch. With most processes involving water or airflow, you really can't see much of what's going on, so you need to pause and use your other senses. They really can help supply extra information about the process to help you get it working the way you want.
So when the lawn was having a drink, I could not see any data, or hear any water flow. What was going on? What did I miss?
To cut a longish story short, I missed the irrigation system main cut-off valve in the front yard. Here is a drawing of the water main's layout for our place.
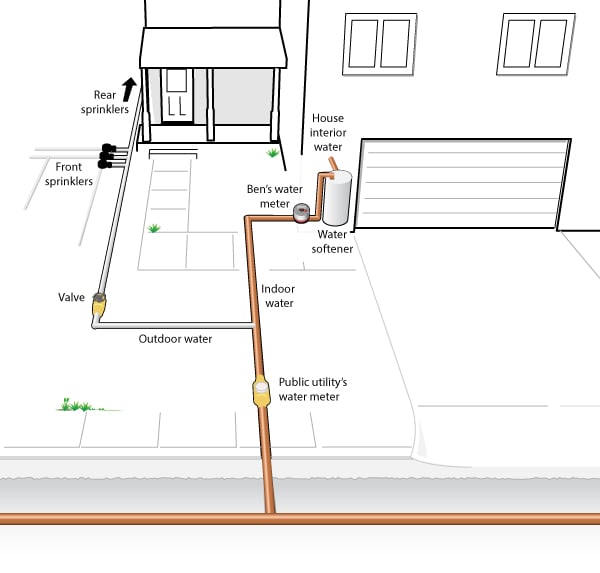
Turns out, after talking with a few other people, this is pretty typical. The irrigation is T'ed off just after the water meter, goes through a manual cut-off valve, and heads off to the first bank of water solenoids, usually located in the front yard.
Why did I miss it? Because the cut-off valve box had lawn grown over the top of it! I did not know to go digging for it, and so I just walked right over it when I was scouting things out. Bahh.
So I now have a water meter that only shows water usage for the house. The irrigation system is a total unknown.
Yes, I could look at the house meter once a month and subtract that from my water bill and end up with the irrigation system, but I would like faster feedback than that.
I'm having a bit of fun, but it seems that there is a bit of a "rule" here at Opto, and that is: if you work at Opto, you have to put your irrigation system on Opto. Many of us here, both software and hardware guys and girls, have done that, and it affords all sorts of interesting lawn watering opportunities.
Back to the question at hand, how can I pick up my main's water meter reading? (I have some, OK, one, very firm idea, but I would love to hear if anyone else has some method of getting this data).
There are a few cement paths between me and the meter, so I can't dig a trench (OK, OK, never say never, but it would be a lot of work tunneling under them).
Radio is obvious, but it needs to work 24/7, so it will need to be very low power. Wifi would be nice, but it's not exactly low power.
Also, I would really like it to be live. Yes, I could have a store-and-forward Wifi device that sent the data every 15 minutes; that would help with the power budget. But as I said, I think the real value and power of this data is to have it live.
So jump on the comments and let me know your crazy or otherwise ideas of getting the pulses from the main's water meter (hehe, there is a pretty big hint to my current thinking).
CONCLUSION:
At this point we have not made any major changes to our water use, but we are looking at that water softener pretty closely.
Without the data, we simply were guessing at how we were using/saving water. Sure, we were looking at our monthly water bill, but the instant feedback that we get with groov makes all the difference. We can see the dishwater run, we can see what washing the Smart Car costs, and yes, we can compare our shower habits the instant they happen.
There is no question that the whole family is more involved in the process when everyone can see their impact in a web browser on their mobile device. (It was almost fun hearing my two kids argue about who uses the most water in the shower.)
It can be the same in manufacturing and industry in general. The water bill is paid by the accounts department, but they probably are not the biggest users of water at your workplace. Why not use groov to display key data points for all to see?
Next week we will look at that mains water meter and how we can pick up its data.
Till then, Cheers Mate.