
Tips when using PAC Project with groov View, MQTT, Node-RED, RESTful API, and more
Are you wondering what else you can do to improve your PAC Project system’s performance? Did you optimize your SNAP PAC system and apply the same techniques to your groov EPIC system? There may be some other options you might not think of, like these:
-Moving groov View or MQTT to an alternate host task-Enabling only essential tags as "Public" for Ignition or MQTT
-Scanning only PAC Control variables and tables if you’re using Node-RED
Whether you’re running an edge device like groov EPIC or a classic SNAP PAC system, performance optimization is a balance among logic, I/O communication, and HMI responsiveness. You might find some time savers in the Optimizing PAC Project System Performance technical note.
Here are a few highlights from the tech note.
Divide and Conquer with Alternate Host Tasks
The Host Task handles communication between your PAC Control controller and software like PAC Display, groov View, or a SCADA. By default, it uses TCP port 22001.
To optimize EPIC performance, you can use the PAC Control Start Alternate Host Task command. This command lets you "divide the workload."
- Port 22001 (Default): Keep this free for the PAC Control debugger
- Alternate Port: Direct your groov View, Ignition, or MQTT traffic here
Because each host task is independent, a heavy HMI scan on one port won't slow down the communications on another.
Optimizing MQTT Communications
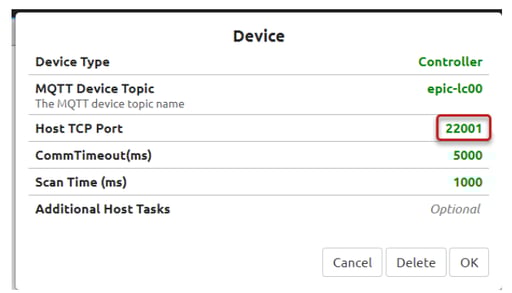
MQTT is built for efficiency, but how you configure the "Device Type" in groov EPIC or groov RIO affects your throughput.
- Table Publishing: Rather than marking dozens of individual variables as "public," move them into a single table within your PAC Control strategy and make only that table public. This is much more efficient for the MQTT service to scan and publish.
- Choose the Right Device Type: Use the "OptoMMP" device type to scan I/O directly via port 2001. If you use the "Controller" device type, MQTT must compete for resources on the PAC Control host port.
-
Isolate Traffic: Use an Alternate Host Task in PAC Control specifically for MQTT traffic. The alternate host task keeps your data publishing separate from your logic debugging and HMI scanning.
Fine-Tuning Node-RED
When Node-RED runs on a groov EPIC, it communicates via the default host task (TCP port 22001). Alternate host tasks aren’t supported.
To keep your flows from dragging down system performance:
- Stick to Variables: Avoid reading I/O directly in Node-RED. Use your PAC Control strategy to move I/O data into tables or variables and scan those instead.
- Watch Your Intervals: Increase the interval on "Inject" nodes whenever possible. The default 1 second interval is often faster than necessary and creates a constant, unneeded processing load.
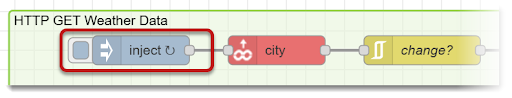
- The Power of Primes: Reduce simultaneous CPU spikes by using prime numbers for your intervals (for example, 3 and 7 seconds). This ensures that multiple nodes rarely trigger at the exact same millisecond.
Multi-Core vs. Single-Core Architecture
The way your controller handles tasks depends on its architecture.
- SNAP PAC: These controllers use a single-core CPU and a round-robin multitasking system. The controller sequences through the host task and active charts, giving each a 1 millisecond (ms) "time slice."
- groov EPIC: Has a multi-core CPU running a custom Linux OS. Instead of a strict round-robin, the OS distributes PAC Control charts and other processes (like Node-RED, Ignition, or MQTT) across available CPU cores.
EPIC Diagnostic Tip: Because groov EPIC runs many services simultaneously, high CPU usage is tricky to diagnose. A good test is to stop the PAC Control strategy and watch the impact on CPU usage, then do the same for other applications one by one (such as groov View, OPC UA, etc.) that are running on the EPIC controller.
The Golden Rule: Use Delays
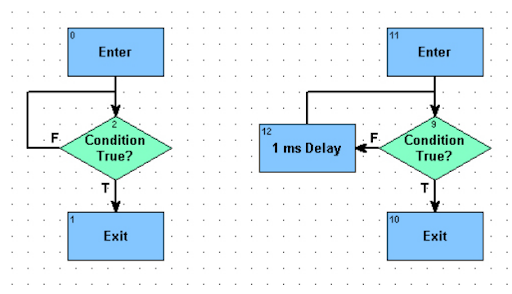
By far, the top way to use your CPU efficiently is to use the Delay (mSec) command in programming loops in your PAC Control logic.
- The Problem: On a SNAP PAC, a chart without a delay will use its entire 1 ms time slice just checking a condition. On a groov EPIC, a single chart without a delay can actually monopolize an entire CPU core, driving up usage and potentially causing timeouts in other processes.
- The Fix: Use delays in all looping charts in PAC Control. Evaluate how often you actually need to check a condition. For example, temperatures change slowly and might only need checking every few minutes, while a switch might need to be checked every 100 ms.
You’ll find these and several other tips with details in the tech note. Optimizing your system takes effort, but applying these tips one at a time and evaluating the effects reduces latency and prevents CPU bottlenecks.
