Of course you can include a trend in your PAC Display HMI or groov mobile operator interface and watch a value in your SNAP PAC System rise and fall over time. Or you can inspect a quick "plot" of it in PAC Control Pro's Debug mode.
But what if you just want to take a quick look at how high or how low an analog value has been, say, today?
This tip shows you how to do that using PAC Manager.
Suppose you have a refrigeration unit and you're monitoring its temperature with an analog input module like the SNAP-AICTD.
One of the cool things about SNAP I/O is that the I/O processor (the brain) provides a lot of functions automatically. You don't have to program latching, for example, or counting, or thermocouple linearization. And you don't have to program minimum and maximum values; the brain tracks those values automatically.
That means you can see how high and how low the temperature has been in that refrigeration unit using PAC Manager's Inspect window.
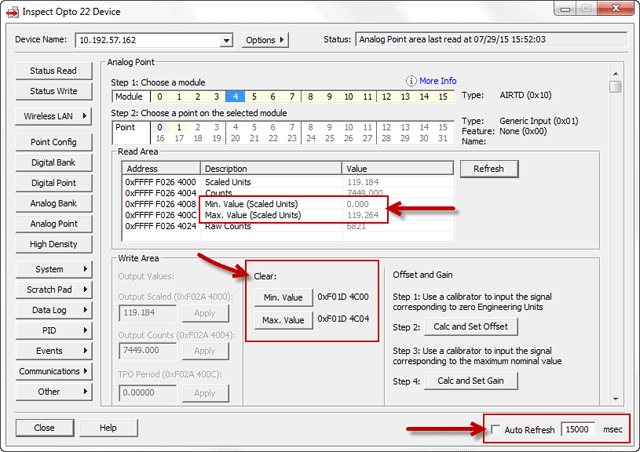
Here's how: Open PAC Manager and choose Tools > Inspect. Enter the I/O unit's IP address. Then click the Analog Point button and highlight the module and point you're interested in. In this case, it's the first point on the SNAP-AIRTD module in position 4:

You can see right there the min and max values for this point in scaled units. These are the highest and lowest values this input has recorded since the last time the min and max values were cleared in the brain's memory map.
If it's the end of the day and you want to see fresh min/max values tomorrow, click the buttons to Clear Min Value and Max Value.
You can also have PAC Manager refresh values on this page automatically at an interval you set. Just check Auto Refresh and enter the number of milliseconds you want between refresh times.
Note that you can also view these values in the Opto iPAC and Opto aPAC mobile apps.
Questions? Contact Opto 22 Product Support.
