Visualizing water usage with groov:
As an Australian living in southern California I have been conflicted lots of times driving around seeing green lawns in baking hot sun.
When we moved to California from Australia in 2008, one of the worst droughts in history was still very much a huge issue for Victoria, the state we lived in. So when we arrived, the seemingly endless sea of green really, really surprised us all.
Australians have had little choice but to let their lawns brown off (often totally die) in the summer for many, many years...... It's just a fact of life of living in a sunburnt country.
As soon as we were able to buy our own home, I knew that monitoring our water usage was up near the top of my to-do list.
The challenge was how to share the data with the family, my wife and two teenage kids.
groov:
groov is a drag-and-drop way of building and viewing web pages. Even before it was released I was running a copy of it at my house (hey, there have to be a few perks of the job, right?), so the family already knew the power of seeing our home automation-type data in a web browser.
My wife has an iPad, my daughter runs Linux on her laptop, my son runs Windows on his PC and Android on his phone. I also run an Android phablet and use a Chome Box for surfing the web.
Sounds like a mess, right? Not at all. What do all of these OS's have in common? A web browser. We could all bookmark our home groov Server and view the data any time we wanted.
Here is a screen shot of the house water usage page as it stands at the moment.
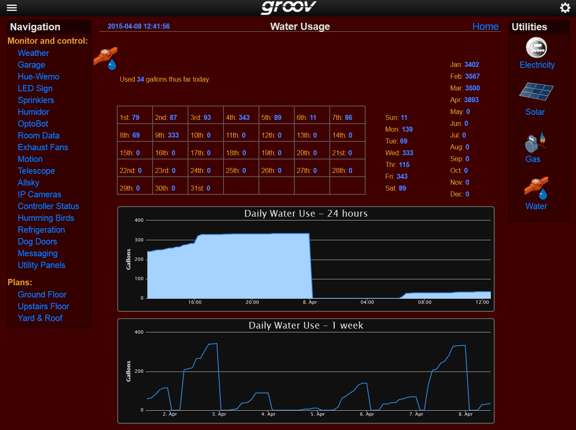
It's pretty basic messy, but functional.
It shows the "same" data a few different ways.... First up, we have live data of exactly how many gallons we have used thus far each day.
Then we have a rolling week display to see how much we are using today compared to yesterday.
There is a monthly view by day and a by-month view for the year to date. These get summed at the end of each night, and each month.
The reason for the different views of the same data is I like to experiment with different user interfaces in groov and see which ones people like—basically, my house is one big groov/Opto/Wifi experimental sandbox.
Let's take a closer look at how we get the water usage data into groov, starting at the water meter.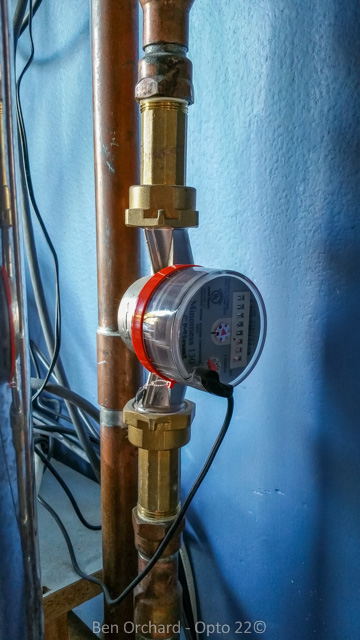
The meter I bought is for residential use, but the principle applies to industrial meters as well.
We had a plumber install it where the water main enters into the house. This happens to be in the garage.
As you can see, inside the meter is a paddle wheel. Not shown is a reed switch that closes and opens each time 1 gallon of water flows through the meter.
It was a super simple job then to connect the two wires coming out of the meter to the two screw terminals on the SNAP-IDC5-SW.

BTW, I really love this input module and feel it just does not get enough love! Why? It just has to be the eaiest way to hook up a digital input for a switch (i.e. dry contact). As you can see in the diagram, it's just two wires.
The module itself supplies around 15 volts DC. At that voltage, you can use a pair of twisted wires up to around 1000 feet in length and still get a reliable signal.
The module also limits the current it supplies to 7 milliamps, so it is not going to burn out the small reed switch contacts in the water meter.
Don't be too harsh on me (it's my home after all), but I simply ran a bit of old speaker wire around the edge of my garage from the water meter to my rack of I/O where the digital input module is mounted.
It was quick and cheap to get the meter output into the strategy where I could start to add up the pulses and keep an eye on the water usage.
The count is a variable in my strategy so it's simple then to link it to many different groov gadgets. The Trend gadget is one of the most powerful (IMHO).
As you can see in the screen shown above, the trend shows that there are two very large amounts of water usage each week. What's up with that?
CONCLUSION:
I feel the water meter was in a sweet spot for a cost-to-information ratio. We had the plumber do some other work while he was at the house, so the installation costs were spread over the whole job and were very reasonable.
The resulting data really surprised me once I started trending the pulses from the meter.
Tune in next week to find out just what caused me to simultaneously smile and frown.
Till then, Cheers Mate.