
The first step toward reducing your energy spend is to analyze your utility bill.
In my previous blog post, “Why Consider Energy Monitoring” I proposed that acquiring data was essential to any project targeted at reducing an organization's energy spend. I also touched on how the electric utility bill for industrial users can be complex.
If you are considering monitoring your energy and power, a good first step would be to get a hold of and understand that bill. I thought I would analyze and share my thoughts on Opto 22’s bill, as it is probably very similar to the one for your industrial or commercial facility.
The copy of our bill I received from the Opto 22 accounting department was for the period of 8/22/23-9/20/23 and was $47,578.01. The Opto 22 facility is a two-story, 150,000 sq. ft. building with half the space dedicated to light manufacturing and the other half typical office space. The summer months in Temecula California are hot, and thus a large part of our energy load during these months is from cooling the building.

Opto 22, like many medium to large ratepayers, is on a “TOU” (Time of Use) schedule. So the first thing I notice on the bill is three different cost periods during a day for the summer months of June 1 to September 30.
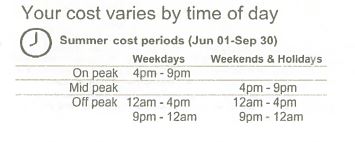
I was curious if these periods were different during winter, so I checked an earlier bill and indeed, saw that the winter months only had mid-peak and off-peak periods.
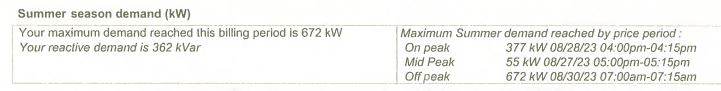
The next thing I was looking for, which I found on page 2, was information about our “Demand.” The Demand value is crucial (which I’ll explain), and I see that the highest demand during any 15-minute interval was 672 kW. That it is further broken down by the time period in which it occurred.
The real fun starts on the third page, which has a detailed breakdown of the charges. Let’s dive in…
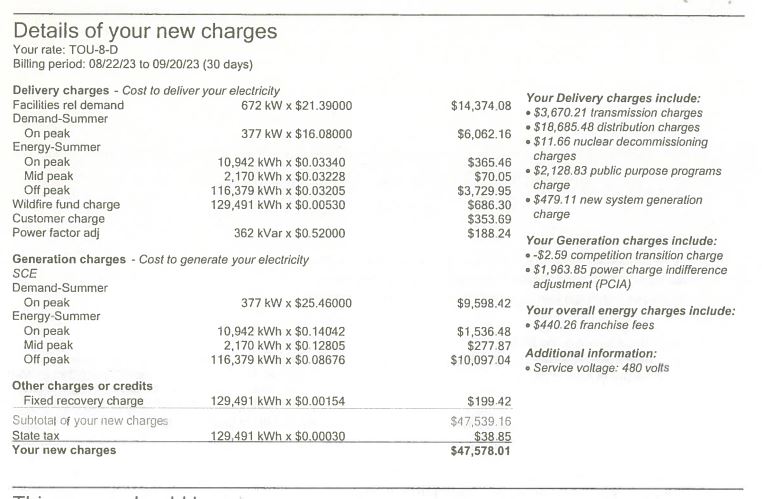
As you can see there are two categories - Delivery charges and Generation charges, with two main subcategories being Energy (in kWh) and Demand (in kW). Energy is consumption, and Demand is power, which goes up and down based on the behavior of the various loads in your facility. To use the analogy of a car, energy would be the fuel consumption and demand would be speed. We will focus on demand, which I’ve found many customers I’ve worked with over the years are unaware of.
Your utility company measures your Demand by capturing the maximum power (kW) value of your facility, measured at fifteen-minute intervals and stored in a register in your meter. This highest value during the billing period is multiplied by a “tariff” (or ”penalty” perhaps?).
Under Delivery charges, we can see the first charge, called “Facility Related Demand” of $14,374.08 (672 kW multiplied by the $21.39 per kW tariff). The next entry, “Demand-Summer” is an additional charge applied during summer months and is the highest power reading during the peak period (4 pm - 9 pm). This was 377 kW multiplied by $16.08 for a total of $6,062.16. Similarly, under Generation charges, there is an "On peak" demand charge of $9,598.42.
I think it is probably clear now why Demand charges are such an important part of the utility bill. For this period, the total of the various Demand charges was $30,222.90, as compared to the total of the Energy charges of $16,076 (and miscellaneous charges of $1,278.26).
So what can you do with this information?
There are steps you can take to lower your energy consumption, but, for manufacturers who have production goals to meet and personnel schedules to manage, things like shifting production to off-peak hours may not be feasible, and stopping production is probably not an option. You'll want to start with the “lower hanging fruit” that can have an immediate and significant impact on lowering your electric utility bill—demand. For example, on the bill we are analyzing, a mere 10% reduction in the peak power of 672 kW would have resulted in a savings of $1,437.40.
Opto 22 reduced demand significantly by doing things like staging compressors, cycling our four air handling units, and exposing faulty equipment, all possible by the visibility that resulted from implementing monitoring and data acquisition (see details in this case study).
There are other measures that can be taken once you’ve first understood your power profile, like replacing motor starters with variable speed drives, detecting and fixing compressed air leaks, and peak shifting to backup power systems, to name a few. In many cases I’ve seen the result is much higher than 10%, being closer to 20-30%, making the ROI period for any investment very short. I will add that it is important to baseline before making any changes, and collect data after each change so your results can be measurable and specific.
If I’ve inspired you or even peaked (pun intended) your interest in reducing your demand charges, and I hope I have, note that there are a few issues with using demand data provided by your utility. Getting data from your utility bill is like looking in a rearview mirror. Granted, most utilities have a portal that you can log into and see a graph of your demand curve, but the data is typically at 15-minute intervals. Also, the data is for the entire facility as a whole. To truly analyze the areas, machines, or processes where you can reduce peak power, the data needs to be more granular and in real-time.
The Opto 22 groov RIO-EMU (energy monitoring unit) is an excellent product for measuring power and energy at subpanels in your building or connecting directly to machines or other pieces of equipment. It is easy to install and configure, and has a variety of ways to share data with software applications, HMIs, SCADA platforms, historians, etc. Visit our Technology Partners page for data visibility, storage, and analytics options, our OptoPartners page for systems integrators, and as always Opto 22 Applications Engineers are here to help.
Remember, it’s all about data…and that starts with first getting a copy of your energy bill.