
Take a closer look at the new EPIC I/O module (GRV-IVAPM-3) and get up to speed on how to install and configure it for your power monitoring applications.
Hopefully, you caught the recent blog post that announced our new 3-phase groov Power Monitoring module (GRV-IVAPM-3). In this next blog post, we’ll take a closer look at this module to help you get up to speed on how to install and configure it for your power monitoring applications.
This module will allow you to measure live power and energy consumption of any three, twin or single phase load in Delta or Wye configuration up to 600 volts. Pumps, heating and cooling, solar, you name it, you can measure its power and so better understand your costs and see changes in load that might give an early warning to faults.
Keyed Terminal Connector
One of the first things we need to go over is the terminal connector for the power module. Note that it is different from all the other groov modules: The keyway is such that you can not plug the terminal connector into anything other than the power monitoring module.
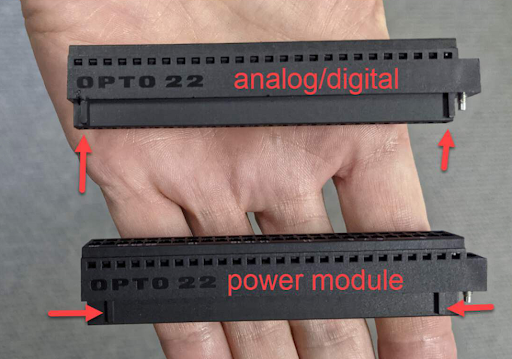
The reason for this is we don’t want you accidentally plugging high voltages into your low voltage modules (and vice versa).
When you look at the top of the module, you can see some differences there as well.
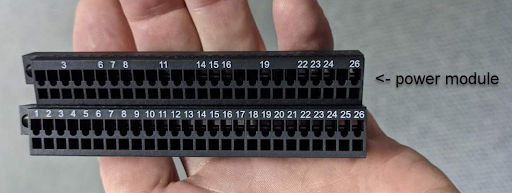
We don’t pad print the terminal numbers on any unused pins. This is to help guide you when it comes time to wiring up the module.
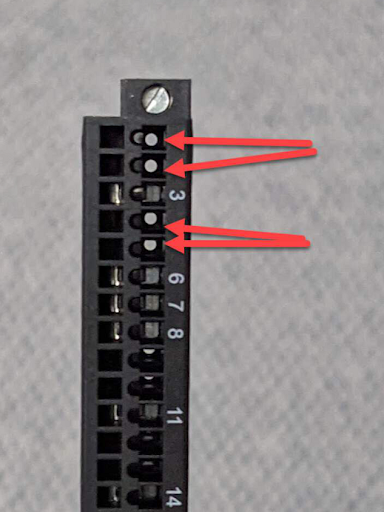
In the above image, you can clearly see how the spring clamps on either side of pin 3 are removed. This is because you might have some applications with up to 600 VAC connected to pin 3, and we need the physical clearance of all other terminals around it to provide the safety isolation.
Wiring the Module
Now, let's take a look at the wiring diagram.
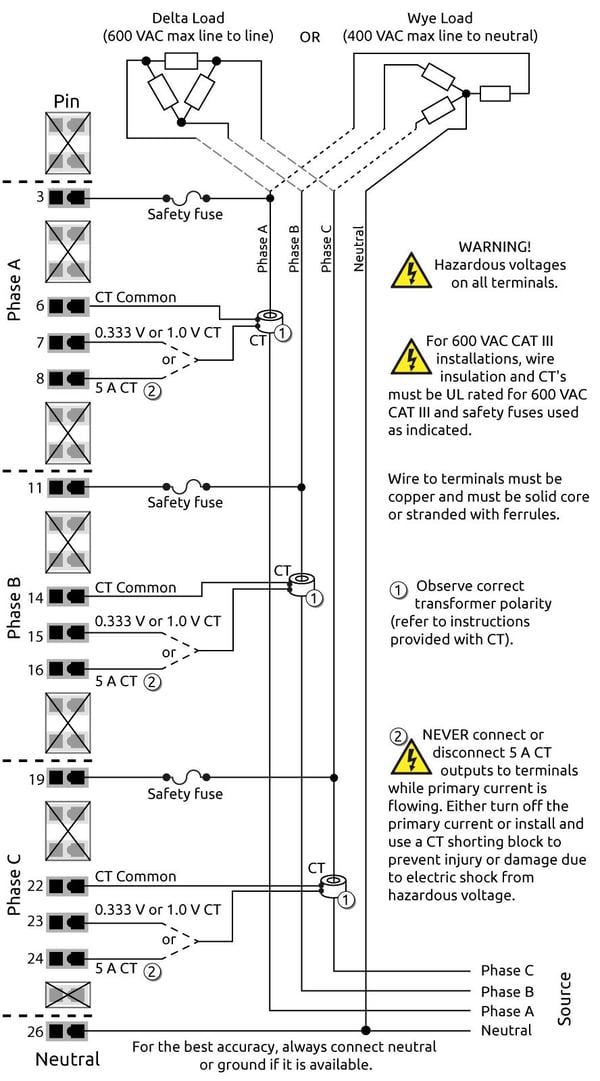
Note the safety fuses on each phase line. Each should be around 1 amp or less, and it should be installed as close to the source as possible.
We recommend using 0.333 VAC current transformers (CTs) as they are smaller, cheaper, lighter, more accurate and safer than their 5 amp counterparts. Be sure and install them with their arrow pointing in the right direction (most have arrows or labels that are pointing to the source of the power, not the load) and ensure they are all installed the same direction and are matched with their respective phase voltage taps.
Some loads (Delta configuration) won’t have a neutral, and that's okay. But if you have one, do install it (Wye configuration).
Configuring the Module
Once you have things wired up and the module installed, let's get to configuring the module.
I am going to be running through the process using groov Manage on a groov EPIC processor. Of course, you could also configure the module from PAC Control or CODESYS, if you’re using either of those control engine runtimes.
Like any groov I/O module, you will find it in the I/O menu. Here, I have three of them installed at the Opto 22 building second floor manufacturing area.
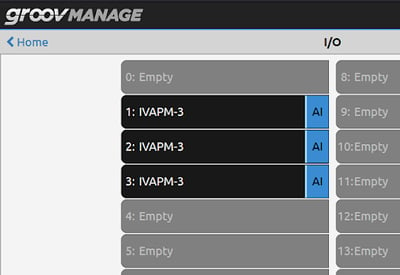
Get started by clicking on the power module you need to set up.
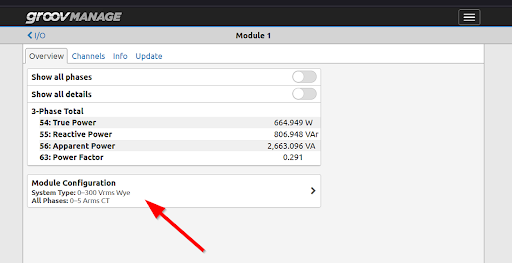
Now, click on the bottom menu option (Module Configuration) and let's configure the module as a whole for all three phases.
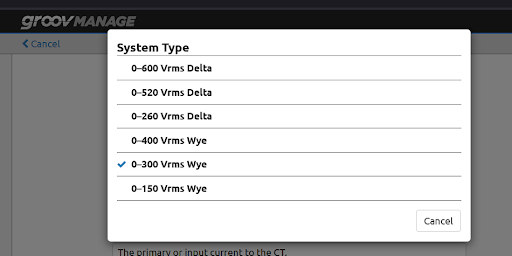
The first thing is to set the mode of the module to match the system it's wired to. Here, we are picking up the many loads in a distribution panel, and it's a Wye configuration (has a neutral) and 300 Vrms.
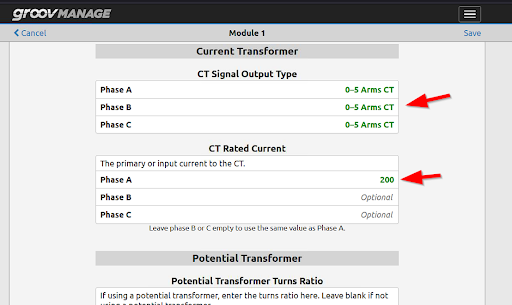
After the type of load is set, the next two important configurations are the CT Signal Output type (voltage or current) and Rated Current value.
In my application, I am using existing, older style 0-5 Amp CTs. If you have a bit of an unusual installation, you could measure three different loads with different types and sizes of CT’s, but in our case, all three phases are using 200 Amp CTs, so we only have to set the Phase A field, and the module will automatically set the other two phases are to be configured the same.

Here is a photo of a 600 AMP CT. You can see it is a split core, so will slip around the existing wiring or bus bar.
The rest of the main configuration page is optional. If you are connected to voltages above 600 VAC for example, you can use a potential transformer (PT) to drop the voltage down, and then configure its ratio.
If you want to set minimum current or voltage thresholds (for example, you don’t want to measure a low overnight current or voltage as part of your energy calculation) you can set them up in the appropriate section here.
One thing to note: If you are not using all three-phase (for example, measuring a small twin-phase load like a house, or perhaps even a single-phase load), then you can quickly turn off a phase by entering a 1 into the “Minimum Voltage Threshold Ratio” area for one or more phases.
Setting Data Options
With those three main settings (Delta or Wye, CT type, CT size), click Save, and you should see some meaningful data straight away.
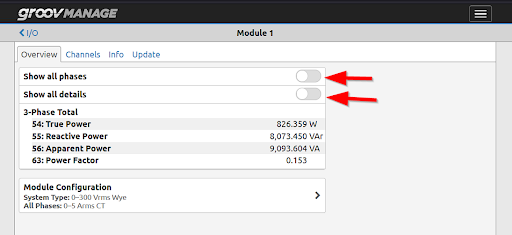
You can toggle the sliders to see more data, and there is a lot to see! There are 64 points of data in total. If you are not using any sort of control engine, then you will probably want to name your channels here in groov Manage.
Click on Channels and then click on Configure to set the options for your data.
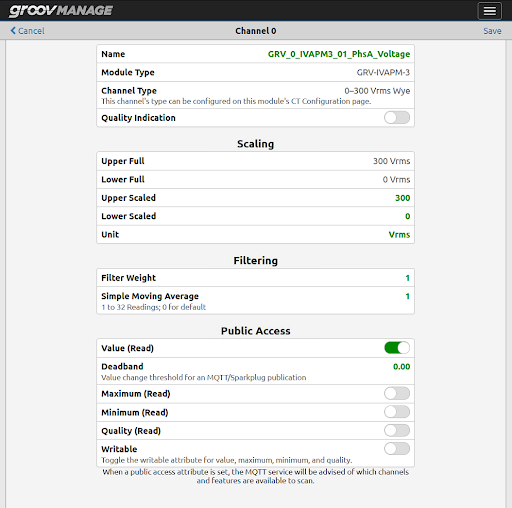
Let's take a look at a typical channel here.
Name: You can name the channel anything you like, but best practices should be followed and give the point a meaningful name for the data it carries. Note the Module and Channel Types are fixed since they are configured by the module configuration screen (Delta or Wye).
The Quality indication can be turned on and off for each channel. If toggled on, the blue LED on the module will turn yellow if any channel goes out of its range.
Scaling is generally left as default, and the filtering can be useful to dampen noisy values. However, don’t over dampen so you can still see what the real channel signal is doing.
Public Access is important if you want to send your data to an MQTT broker with the native groov Manage MQTT client. Public Access is also required for getting your data via the REST interface.
Here, I have turned on the Public Access switch for this channel, which will report every change in value, and thus use some data bandwidth. If you’re transmitting data over a cell modem, or don’t need to know about every little change, bump the Deadband up to a reasonable value for your application.
In my example, I don’t need the Max and Min voltage sent over MQTT or REST, but you can turn them on if you need to see this retained data.
You can also transmit the Quality for this channel. If this channel goes over or under range for example, you will get a bad quality value. Lastly, toggle on Writable if you want to be able to reset the Max and Min values via the REST or MQTT interface.
Once complete, be sure and click Save in the top right corner. Then, you can go on and select the next data channel you want to configure. Note that you don’t have to name and configure all 64 channels, but instead, just the ones that you require for your application.
Understanding the Data
Speaking of data channels, let's take a look at some of them.
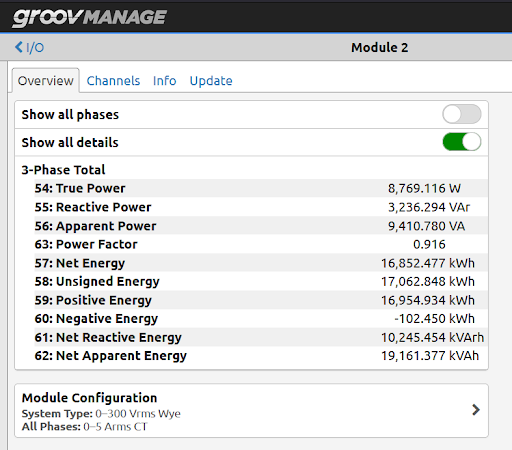
I think it's fair to say that our blog readers will be comfortable with volts, amps and frequency. Where things could get a little more interesting is when we get to the power and energy points. So, let’s take a look at the True, Reactive and Apparent Power values.
The fun starts with understanding that most loads are not pure heating elements (a red hot glowing resistor). They include resistors, inductors and capacitors, and all these change the shape of the current flowing through the load, and thus it is no longer both sinusoidal or in phase with the voltage.
- True Power is calculated from the load's pure resistance component.
- Reactive Power is what your load is ‘rejecting’ and pushing back against the power source. Putting this together, Reactive Power is not part of the True Power value since it's not used by the load.
- Apparent power is the power drawn from the main power source, it is the combination of both true and reactive power. Note this is not a straight sum or adding; there are phase components of each type of power as part of the calculation.
So if apparent power is the source, and the load uses different parts of it as shown by the true and reactive power, how can we quickly see what the ratio of used versus rejected power is?
- Power Factor. This is a very important unitless value. It can tell you a lot about the load that you are monitoring. Power factor (PF) is the ratio of true power used and the apparent power delivered. You can see how a PF of 1 is ideal. All that is delivered (and you are charged by the power company on what they deliver) is used by the load, and there is no waste.
- True Power At Fundamental Frequency is the pure resistive power at the frequency of your power source (usually either 50 or 60Hz).
- Harmonic True Power is the pure resistive power at anything other than the power source’s (fundamental) frequency, i.e., power at distorted frequencies.
The power module energy calculations are the same power values but are the summed values over time.
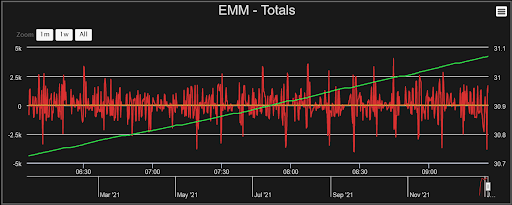
The green plot is energy and the red line represents power. You can clearly see how energy increases over time based on the power used by the load. The interesting thing about this is that we store the energy totals to non-volatile memory on the module every 30 seconds. In other words they won’t be reset to zero after a power cycle.
Each phase's Net Energy is the 1 second sum of the True Power. This value can be read in three different formats. 32-bit IEEE float in units of kWh, 64-bit signed integer in units of mWh, and 32-bit signed integer in units of mWh. And yes, that's milliwatt hours. Some very fine energy data there.
Positive Energy is accumulated by adding the true power only when it is positive.
Negative Energy is accumulated by adding the true power only when it is negative.
Net Reactive Energy is accumulated by adding the reactive power once a second.
Apparent Energy is accumulated by adding apparent power once a second.
Then we also have the total energy calculation for all three phases.
Total Net Energy is the sum of the true power for all three phases.
Total Unsigned Energy is the sum of the absolute value of the true power for each phase.
Total Positive Energy is the true power sum of each phase if they are positive.
Total Negative Energy is the true power sum of each phase if it is negative.
Total Net Reactive Energy is the sum of each phase's reactive power.
Total Net Apparent Energy is the sum of each phase's true power if it's positive.
It's worth noting that while the data freshness of the 64 points of data is around once per second, the values are calculated from Fourier transforms at around 4000 times a second.
There is plenty more to be said, but I hope this is a good overview to help you get up and running with the groov EPIC power module. Everyone here at Opto 22 is very excited to get these modules into your hands and see what applications you come up with.
We also have more news about power monitoring hardware to share soon, so subscribe to the OptoBlog, come hang out on the OptoForums, and be the first to know!
Till next time.
Cheers Mate.
-Ben