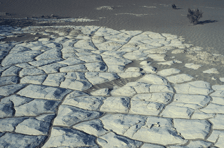
 You've probably heard about the continuing drought in California.
The U.S. Drought Monitor at the University of Nebraska-Lincoln currently categorizes more than 94% of the state's total area as in "severe drought" or worse, and notes that snowpack statewide (from which we get most of our water through the year) is at only 5% of normal.
The worst-hit area is the center of the state, especially the Central Valley that produces many of the vegetables, fruits, and nuts that appear on dining tables throughout the U.S.—and the world.
With so little precipitation Californians have to conserve the water we have. And the best way to do that is to start with data.
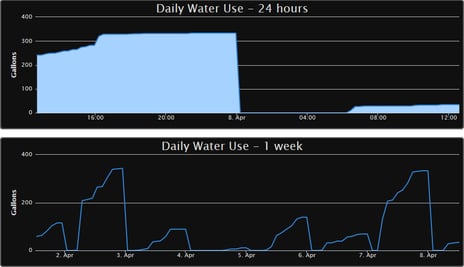
Opto 22's Ben Orchard wanted his whole family to see how they're using water—because once you have data, patterns become visible and you can make intelligent changes.
Data is powerful.

Take a look at Ben's latest blog post and see how he installed a water meter and set up a groov mobile interface that works on all his family's devices. No excuses about not being able to see the data: it's visible on pretty much any smartphone, tablet, laptop, etc.

